


How to overclock a CPU
Overclocking a CPU is a method used by enthusiasts and professionals to increase the performance of their computer processor beyond...
 How to Use “Claude Code” to Build Custom Software Tools for Your Freelance Clients Without a CS Degree
  The Best Ergonomic Home Office Setup for Freelancers: Reducing Neck Pain and Eye Strain for Long Sessions
  How to Find International Clients Who Pay in Stablecoins: A Freelancer’s Guide to Crypto Payments
  Managing “Scope Creep” in the Age of AI: How to Price Freelance Services When Tools Make Work Faster
  How to Set Up a “Local-First” Freelance Portfolio Using Obsidian and Quartz for Maximum Speed
 Overclocking a CPU is a method used by enthusiasts and professionals to increase the performance of their computer processor beyond...
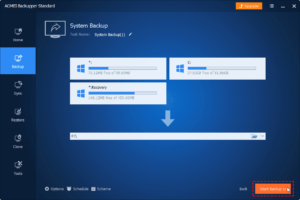
Creating a system backup is crucial for safeguarding your data and ensuring that you can recover quickly in case of...

Squeaky doors can be a significant annoyance in any home, disrupting peace and quiet with every creak. However, fixing a...
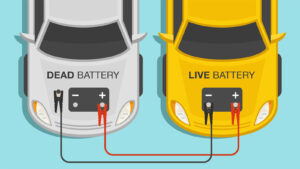
Jump-starting a car is a crucial skill that every driver should know. Whether your car's battery has died due to...

Cleaning a microwave may seem like a daunting task, especially if it hasn't been cleaned regularly. However, with the right...

Ironing a shirt is a skill that combines both artistry and practicality, transforming wrinkled fabric into crisp, professional attire. Whether...

Baking a cake is not just a culinary task; it's an art form that brings joy and satisfaction to both...